Keep Pando healthy: updates, diagnostics and housekeeping
Update Pando, go back a version, share diagnostics when something breaks, read the logs and tidy the database.
This guide is the maintenance corner: how to see that a new version exists and install it, how to let the maintainers look at a problem without pasting logs, and two bits of housekeeping. The desktop app is identical to the Web UI shown here.
See which version you have
Open a chat and look at Version in the info panel on the right. When a newer release exists, it says so and shows the command to run.
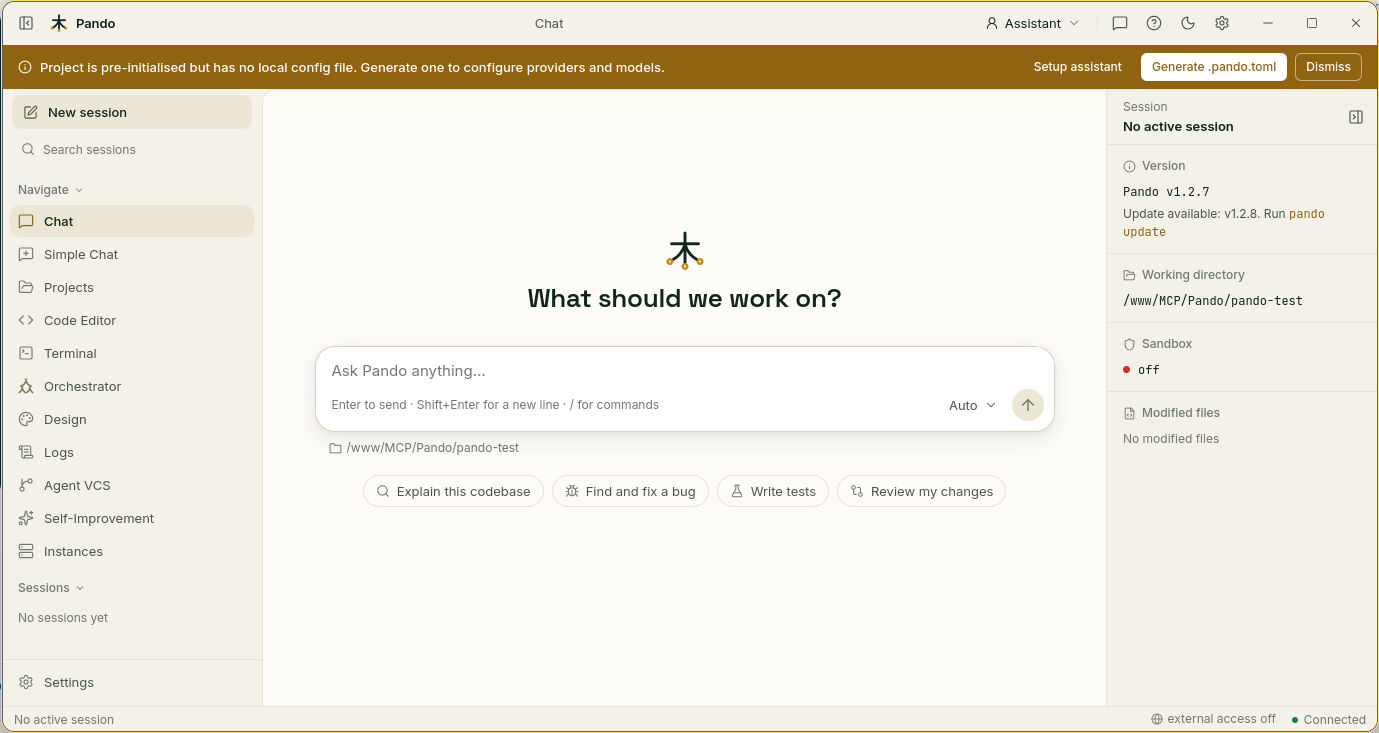
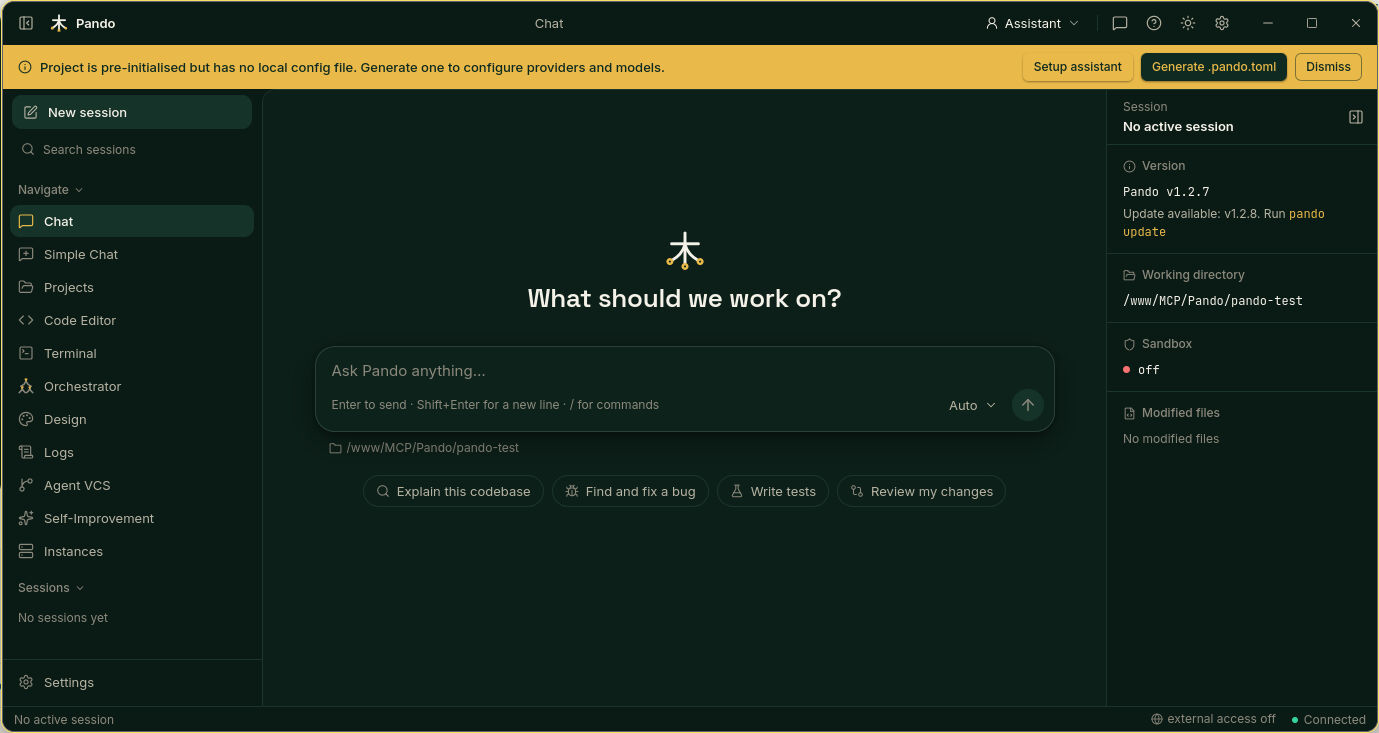
The same information, with a copy button, is in Settings > General > Diagnostics.
Update
Open a terminal (the Terminal screen inside Pando works) and run:
pando updatePando downloads the new release and swaps itself, like changing a light bulb: the old one comes out only when the new one is ready. It is safe to do while Pando is open; restart it afterwards to use the new version.
On macOS, if you installed with the .pkg, download the new .pkg to update Pando.app. See Installers.
Go back a version
If an update does not suit you, name the version you want:
pando update v1.1.1Pando tells you what it is about to do: Installing, Downgrading or Reinstalling. The v is optional.
Turn on diagnostics when something breaks
Go to Settings > General and scroll to Diagnostics.
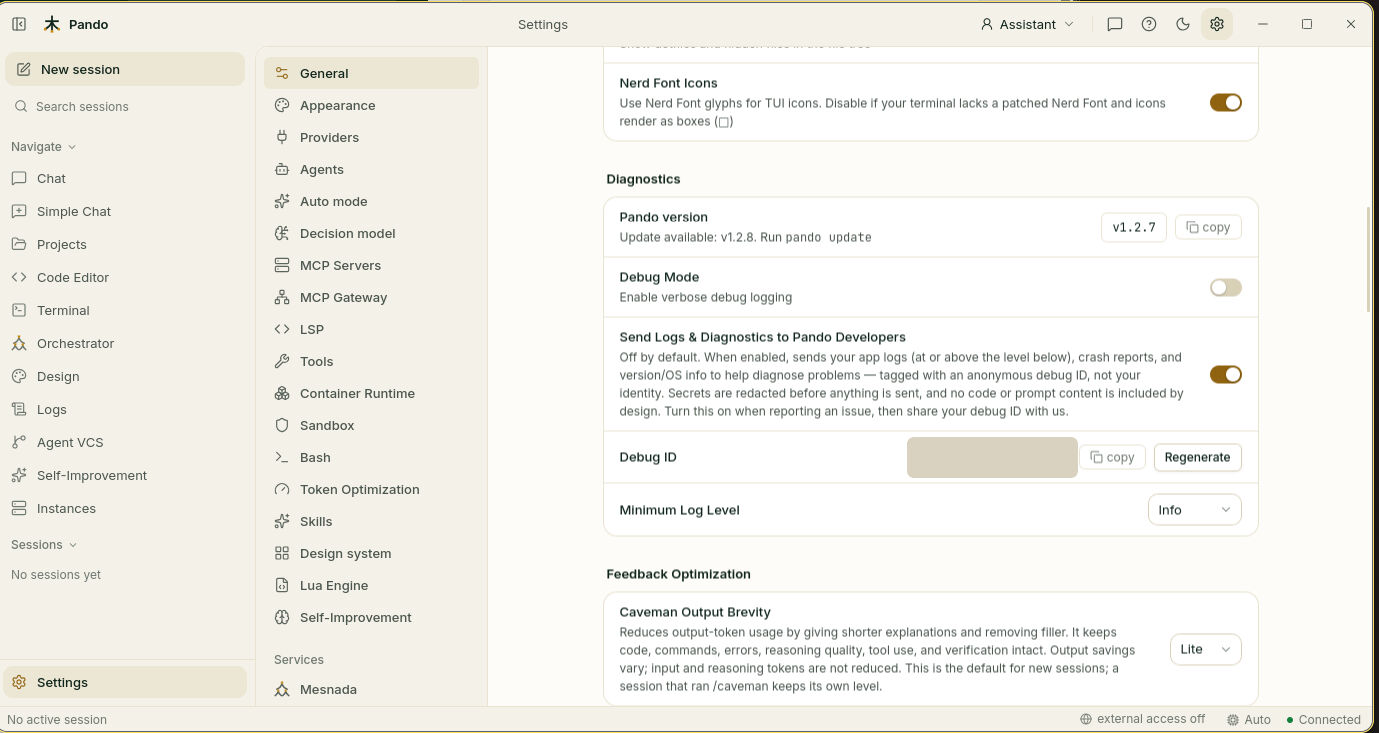
Switch on Send Logs & Diagnostics to Pando Developers. It is off by default; nothing leaves your computer until you do this. Pando shows a Debug ID, a random 16-digit number that works like a ticket number.
Then:
- Reproduce the problem.
- Press copy next to the Debug ID and paste it in your bug report.
- Switch diagnostics off again if you like. The ID stays the same for the whole conversation with the maintainers. Regenerate gives you a new one.
Minimum Log Level chooses how much is sent: everything from Info up, or only warnings and errors.
Your code, your files and your conversations are never sent, and anything that looks like a key or password is blanked out first. The details are in Remote Diagnostics.
Read the logs yourself
Open Logs in the left menu.
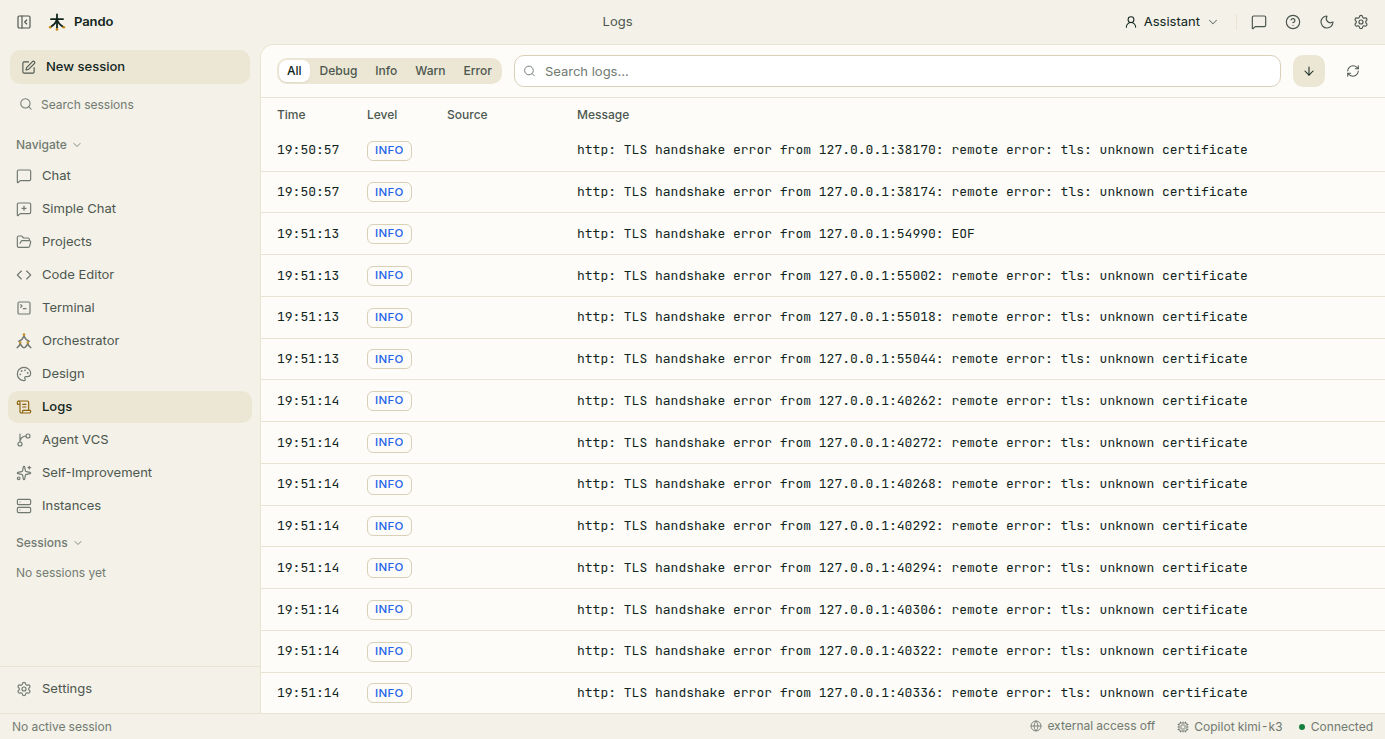
Filter by Debug, Info, Warn or Error, or type in the search box. For more detail, switch on Debug Mode in Settings > General > Diagnostics.
Tidy the database
Pando keeps your sessions and memories in one file. Deleting things leaves empty space inside it, like a notebook with torn-out pages. To hand that space back to your disk, type this in the chat:
/db-compactPando tells you the size before and after. Do it now and then, for example after deleting many old sessions.
Know where your settings live
Pando looks for a settings file next to your project first, then in the folders above it, then in your personal folder. That is why one file at the top of a big repository serves every folder beneath it. The Working directory in the chat info panel shows where the current session is standing. More in Configuration File Discovery.
Check it works
- After
pando update, restart Pando: Version shows the new number and the notice is gone. - After enabling diagnostics,
pando telemetry statussays it is enabled and prints your Debug ID.
If something goes wrong
| What you see | What to do |
|---|---|
pando update says permission denied | You need write permission on the folder where pando lives. Reinstall with the install script, or run the update with the right permissions |
| The diagnostics switch cannot be turned on | You are on a build you compiled yourself. Diagnostics only exist in official releases |
| The desktop app on macOS still shows the old version | Install the new .pkg |
/db-compact takes long | Normal on a large database. It can run while another Pando window is open |
| Pando ignores your project settings | Check which file it found: the nearest .pando.toml going up from the working directory wins |
Prefer the terminal?
pando update --check           # only look for a newer release
pando telemetry enable         # turn diagnostics on and print the Debug ID
pando telemetry id             # print only the ID
pando telemetry disable
pando telemetry level warn     # send only warnings and errors
pando db compact               # tidy the database
pando db compact --incremental # quicker, lighter tidy
pando doctor                   # read-only health check of model routing
In the TUI, diagnostics live under Settings > General > Remote Telemetry. All options are in the diagnostics and maintenance reference.